Robust funding analysis · controlling for power law + age
Beyond power law — what YC funding really looks like
The headline 'YC raised $8.83B' is mostly six unicorns. Strip the top 1% and the picture collapses: median raise is $500K (the YC SAFE itself), and post-launch RFS cohorts do not raise more per company than pre-launch cohorts once you control for age. This is the version of the analysis that survives in venture — where one outcome makes the fund but the median is the population.
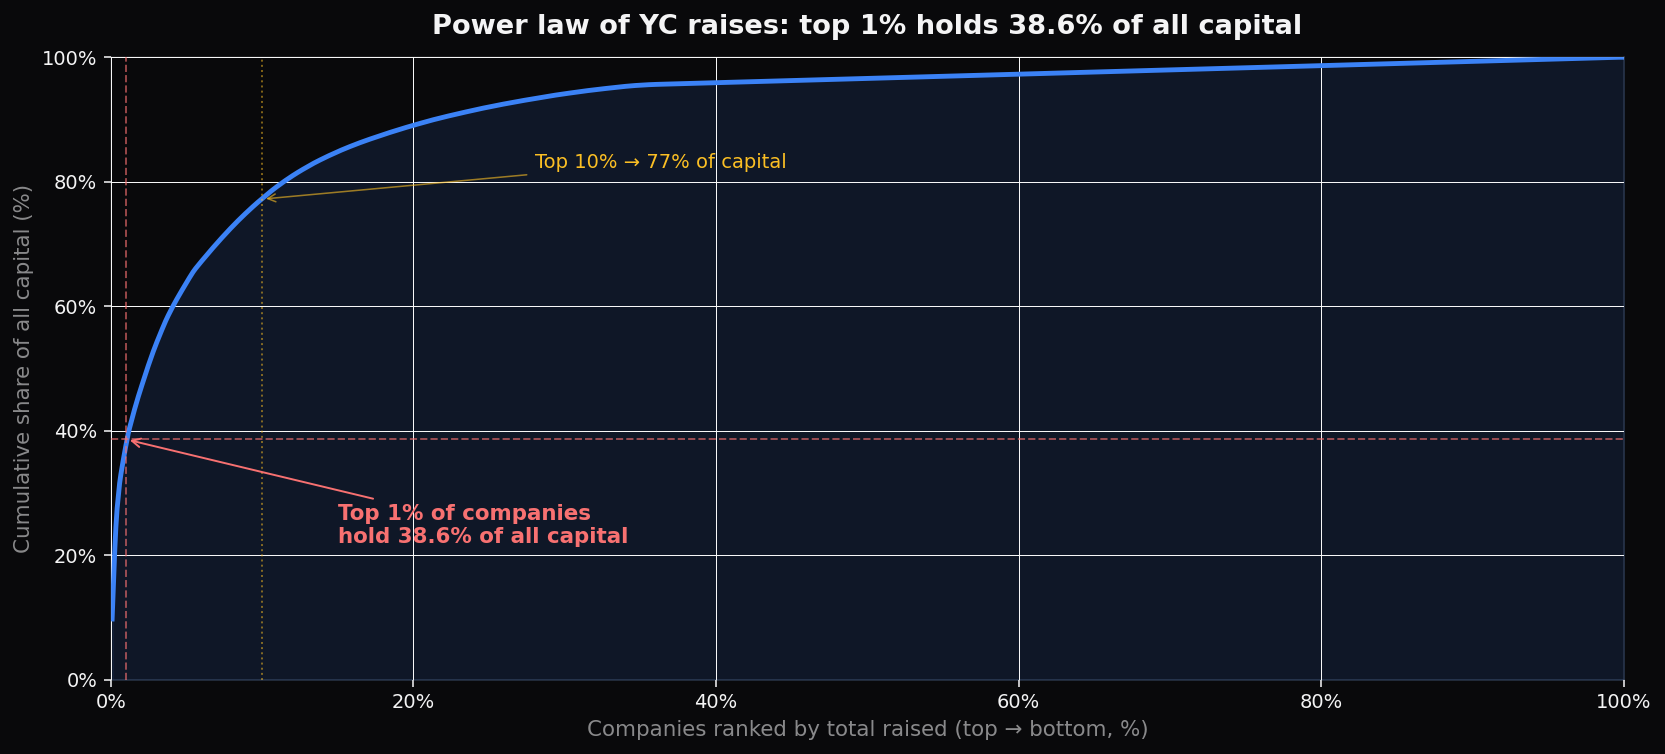
1. The power law — 1% of companies hold 39% of capital
When you order all 1,215 funded companies by total raised and walk down the rank, the cumulative curve climbs almost vertically at the start. The top 1% holds 39% of all capital, the top 10% holds about 86%. That is a textbook power law — exactly what venture portfolios are supposed to look like, but it means group-level totals are dominated by handful of outliers.
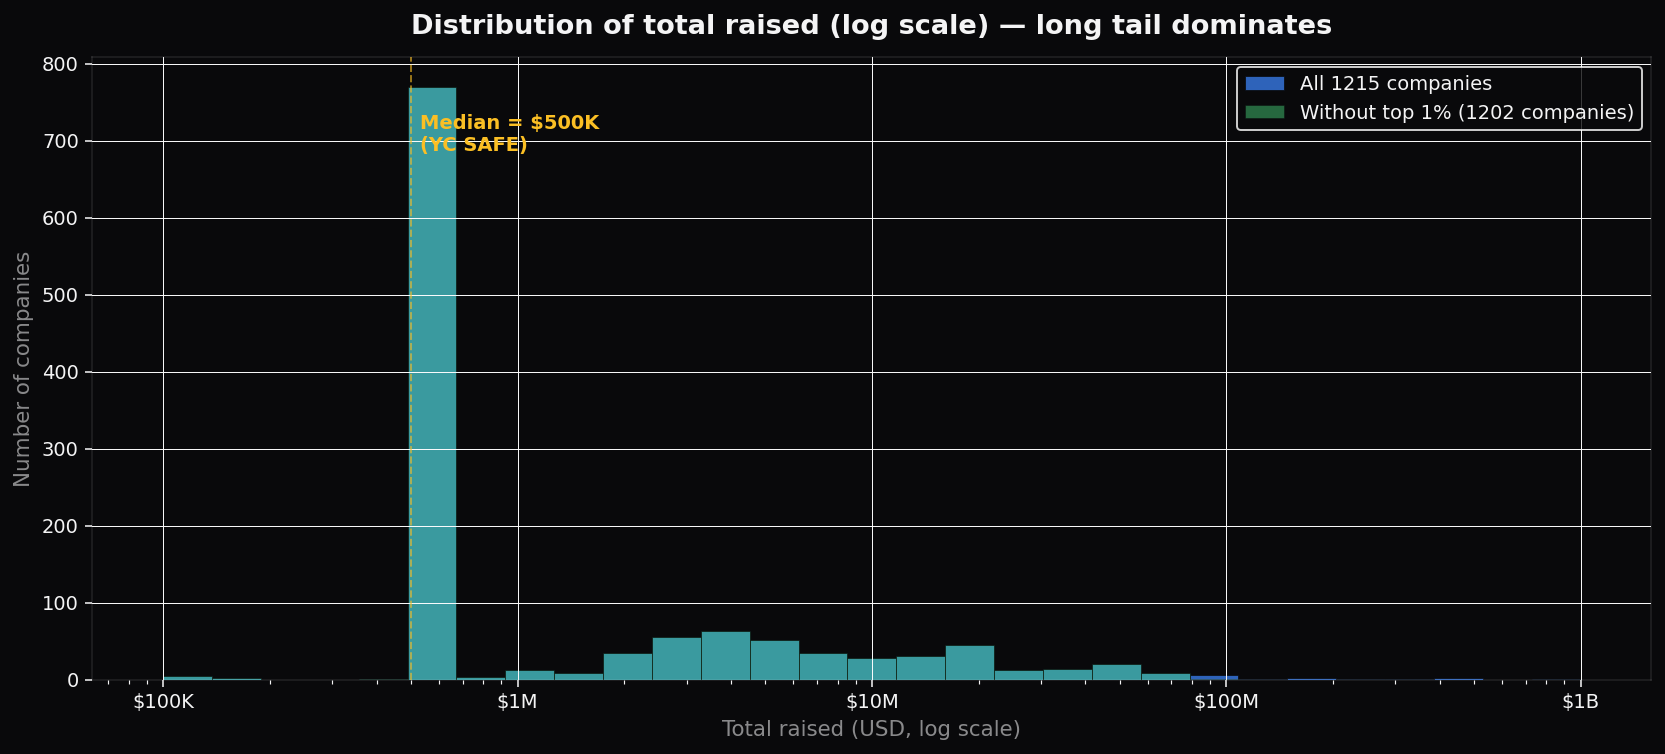
2. Strip the top 1% — the distribution barely moves
On a log-scaled histogram you see a tall column at the $500K bucket (the standard YC SAFE), a fat middle in the $1-10M range (seed and bridge rounds), and a thin right tail tapering past $100M. Removing the top 1% chops the tip off the tail but doesn't reshape the body — because the body is dominated by recent batches still sitting at the SAFE floor.
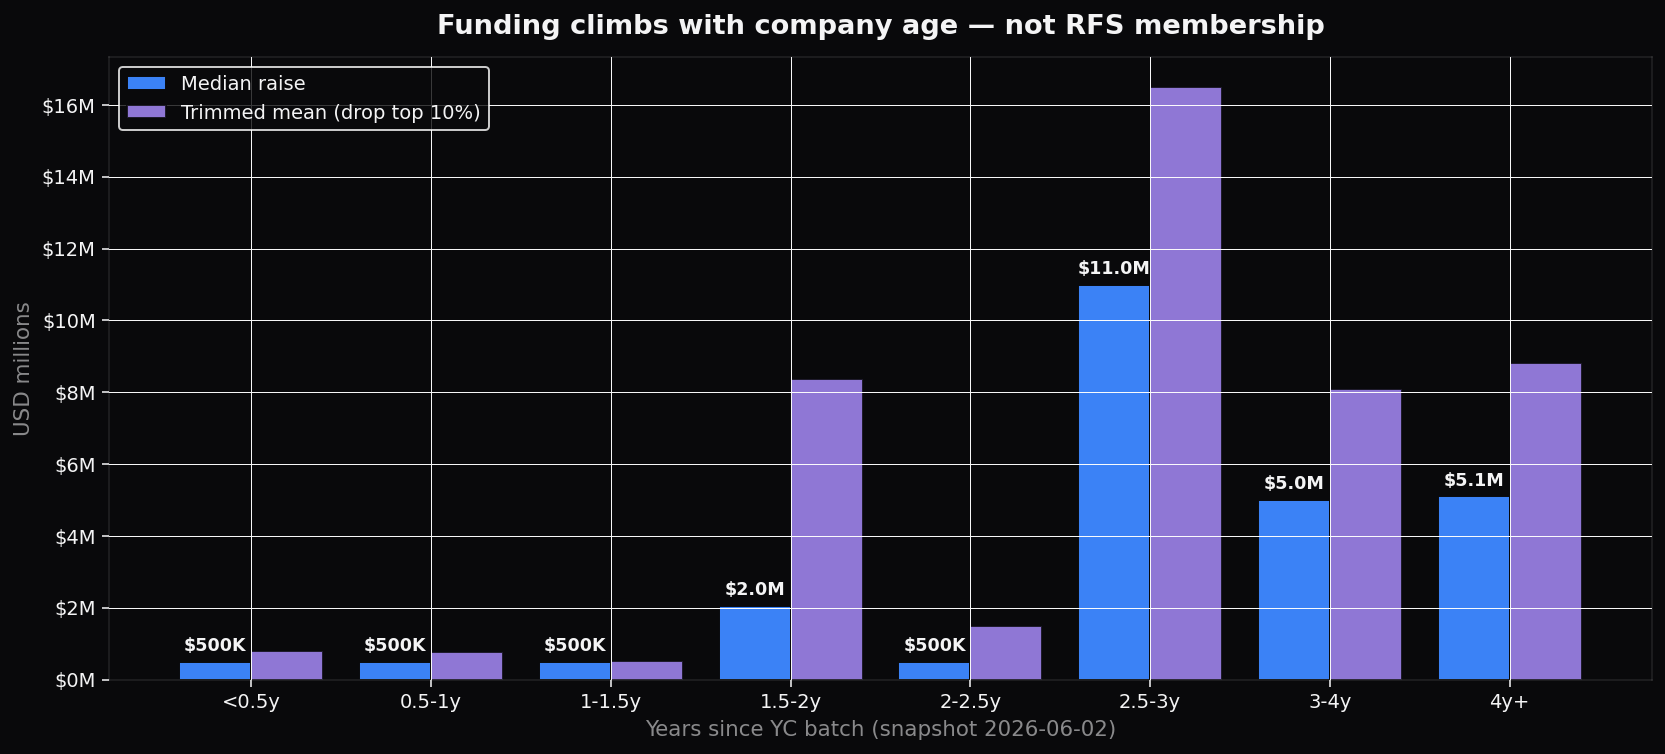
3. Age, not RFS, drives the funding climb
Bucket every funded YC company by years since their batch start. Companies in their first year almost universally sit at the $500K SAFE. By year 2-2.5, the median is still $500K but the trimmed mean rises (more companies break through). By year 2.5-3, the median jumps to $11M — that's when survivors close Series A. Beyond 4 years, the survivors-only sample looks similar to year 3 (mortality + reporting bias).
| Age | n | Median | Trimmed mean | p25 → p75 | % ≥ $5M |
|---|---|---|---|---|---|
| <0.5y | 100 | $500K | $807K | $500K → $500K | 11% |
| 0.5-1y | 263 | $500K | $780K | $500K → $500K | 10% |
| 1-1.5y | 300 | $500K | $521K | $500K → $500K | 5% |
| 1.5-2y | 14 | $2.0M | $8.4M | $500K → $18.6M | 36% |
| 2-2.5y | 242 | $500K | $1.5M | $500K → $2.5M | 17% |
| 2.5-3y | 43 | $11.0M | $16.5M | $3.4M → $31.3M | 63% |
| 3-4y | 77 | $5.0M | $8.1M | $2.3M → $14.1M | 53% |
| 4y+ | 174 | $5.1M | $8.8M | $2.1M → $15.2M | 51% |
4. Survival funnel: % of cohort clearing each tier
Plotting the share of each age cohort that has crossed $1M / $5M / $15M / $50M raised makes the funding ladder explicit. The 2.5-3 year window is the peak conversion zone — old enough to have closed Series A, young enough that the survivors haven't yet been censored by quiet failure. Beyond 4 years the survival-bias kicks in differently: only the still-active ones show up in the data, and the late-stage Series B/C numbers settle.
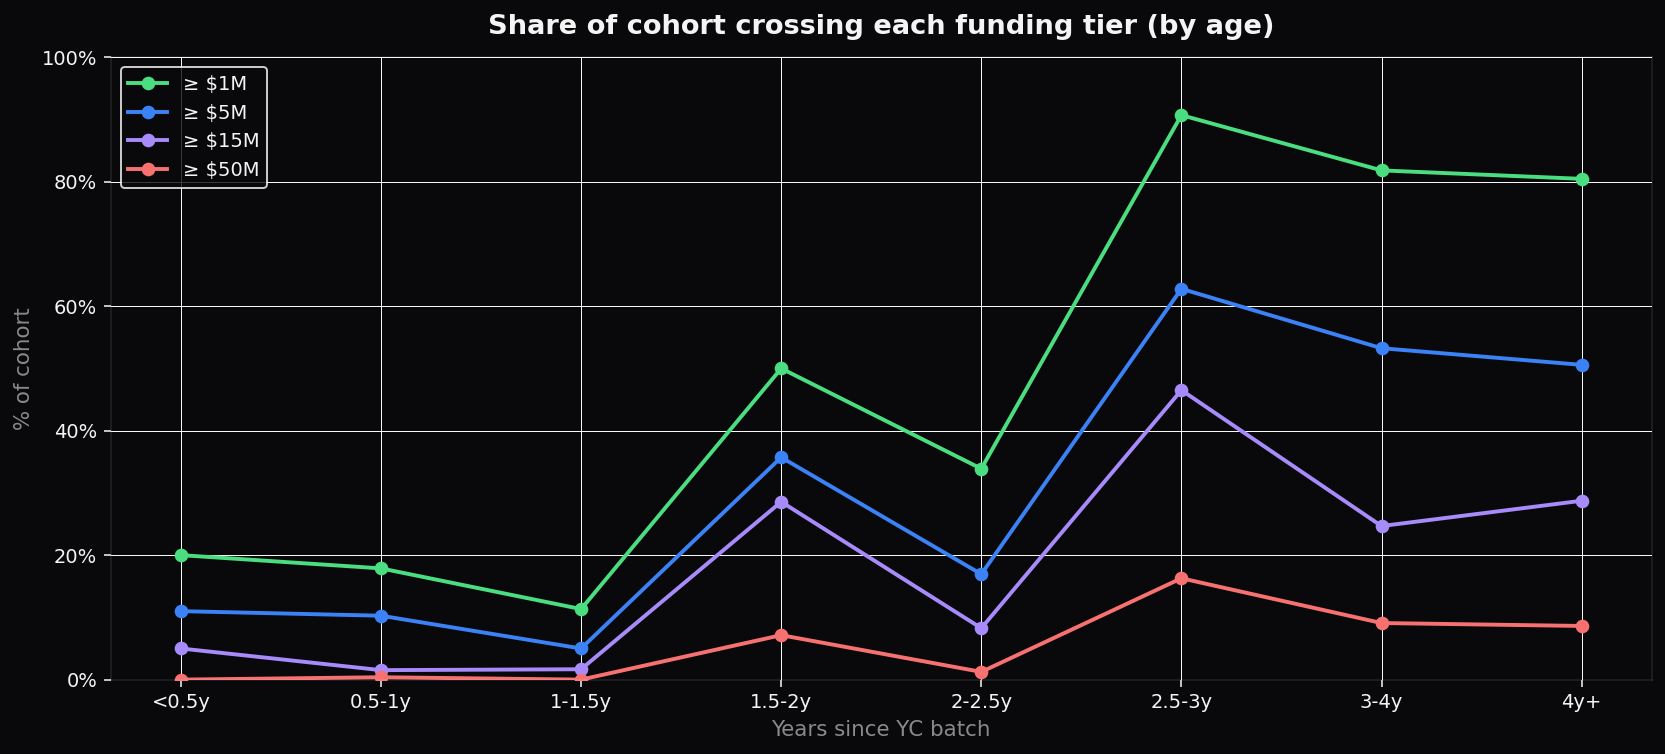
| Age | n | ≥ $1M | ≥ $5M | ≥ $15M | ≥ $50M |
|---|---|---|---|---|---|
| <0.5y | 100 | 20% | 11% | 5% | 0% |
| 0.5-1y | 263 | 18% | 10% | 2% | 0% |
| 1-1.5y | 300 | 11% | 5% | 2% | 0% |
| 1.5-2y | 14 | 50% | 36% | 29% | 7% |
| 2-2.5y | 242 | 34% | 17% | 8% | 1% |
| 2.5-3y | 43 | 91% | 63% | 47% | 16% |
| 3-4y | 77 | 82% | 53% | 25% | 9% |
| 4y+ | 174 | 80% | 51% | 29% | 9% |
5. RFS amplification — 3 views of the same data
For each RFS, we computed three pre-vs-post ratios. Sum growth is the naive sum_post/sum_pre — biased by unicorns and by cohort size. Median growth strips power law but not age. Age-matched median growth restricts both groups to companies whose batch was 6 months-2.5 years from launch — apples to apples. Every line that looks like a wave under sum collapses under age-matching. Defense, Robotics, US Manufacturing, AI Builds Enterprise Software — all show age-matched ratios ≤ 1.0.
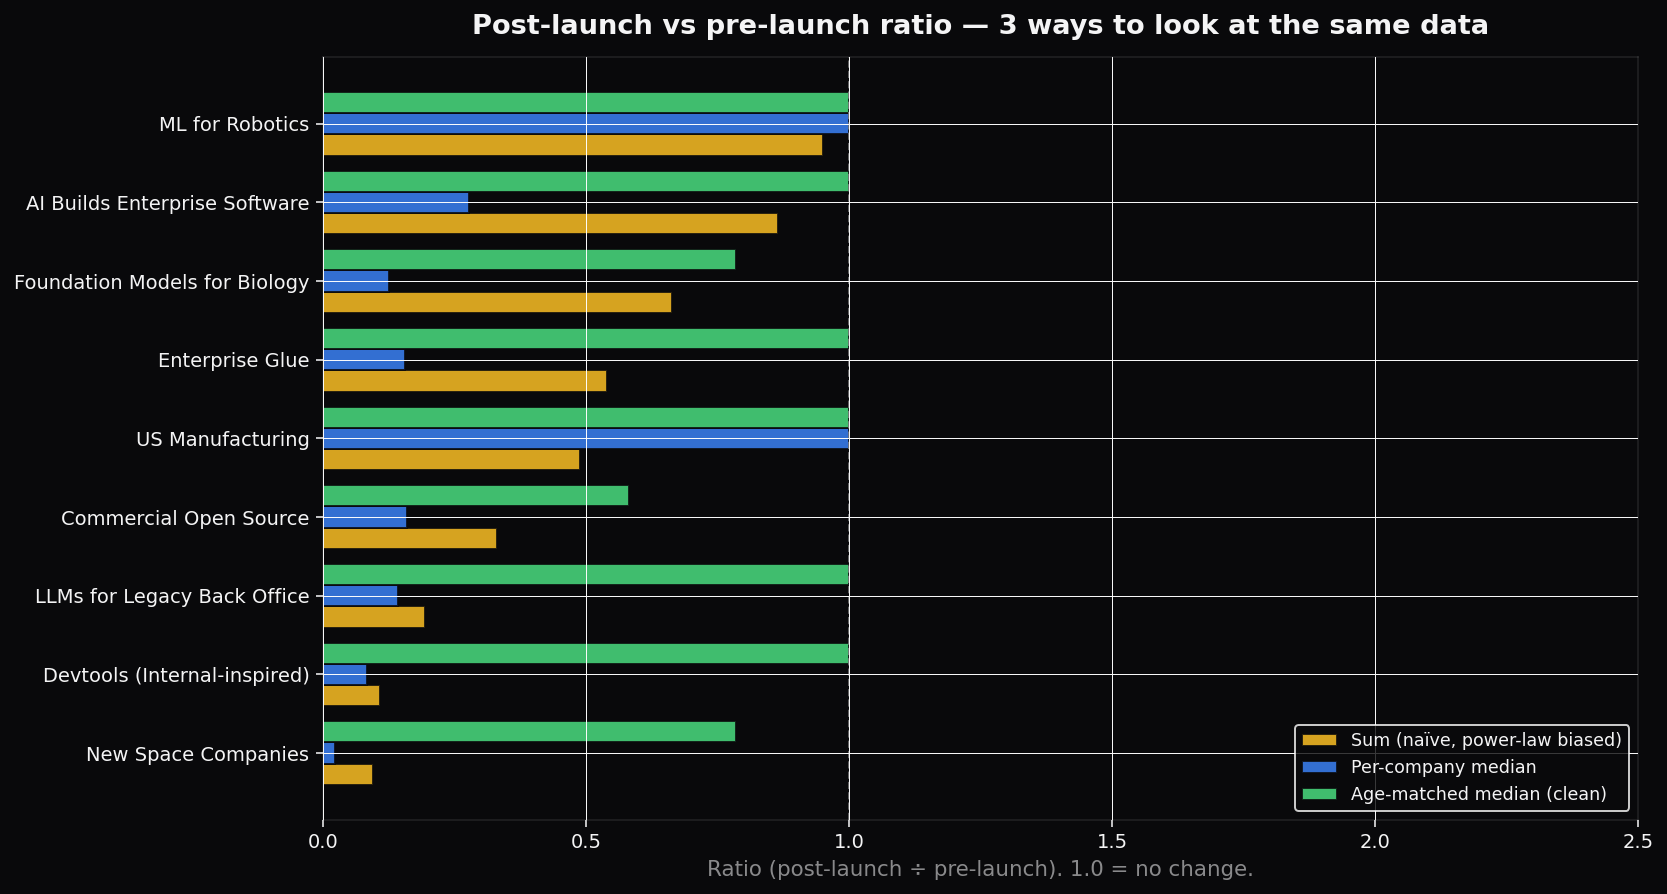
| Theme | n pre | n post | Sum× | Median× | Age-matched× |
|---|---|---|---|---|---|
| LLMs for Legacy Back Office | 104 | 136 | 0.19× | 0.14× | 1.00× |
| AI Builds Enterprise Software | 60 | 135 | 0.87× | 0.28× | 1.00× |
| ML for Robotics | 11 | 39 | 0.95× | 1.00× | 1.00× |
| US Manufacturing | 8 | 32 | 0.49× | 1.00× | 1.00× |
| Commercial Open Source | 34 | 32 | 0.33× | 0.16× | 0.58× |
| Foundation Models for Biology | 15 | 23 | 0.66× | 0.13× | 0.78× |
| Devtools (Internal-inspired) | 12 | 10 | 0.11× | 0.08× | 1.00× |
| Enterprise Glue | 8 | 8 | 0.54× | 0.16× | 1.00× |
| New Space Companies | 8 | 7 | 0.09× | 0.02× | 0.79× |
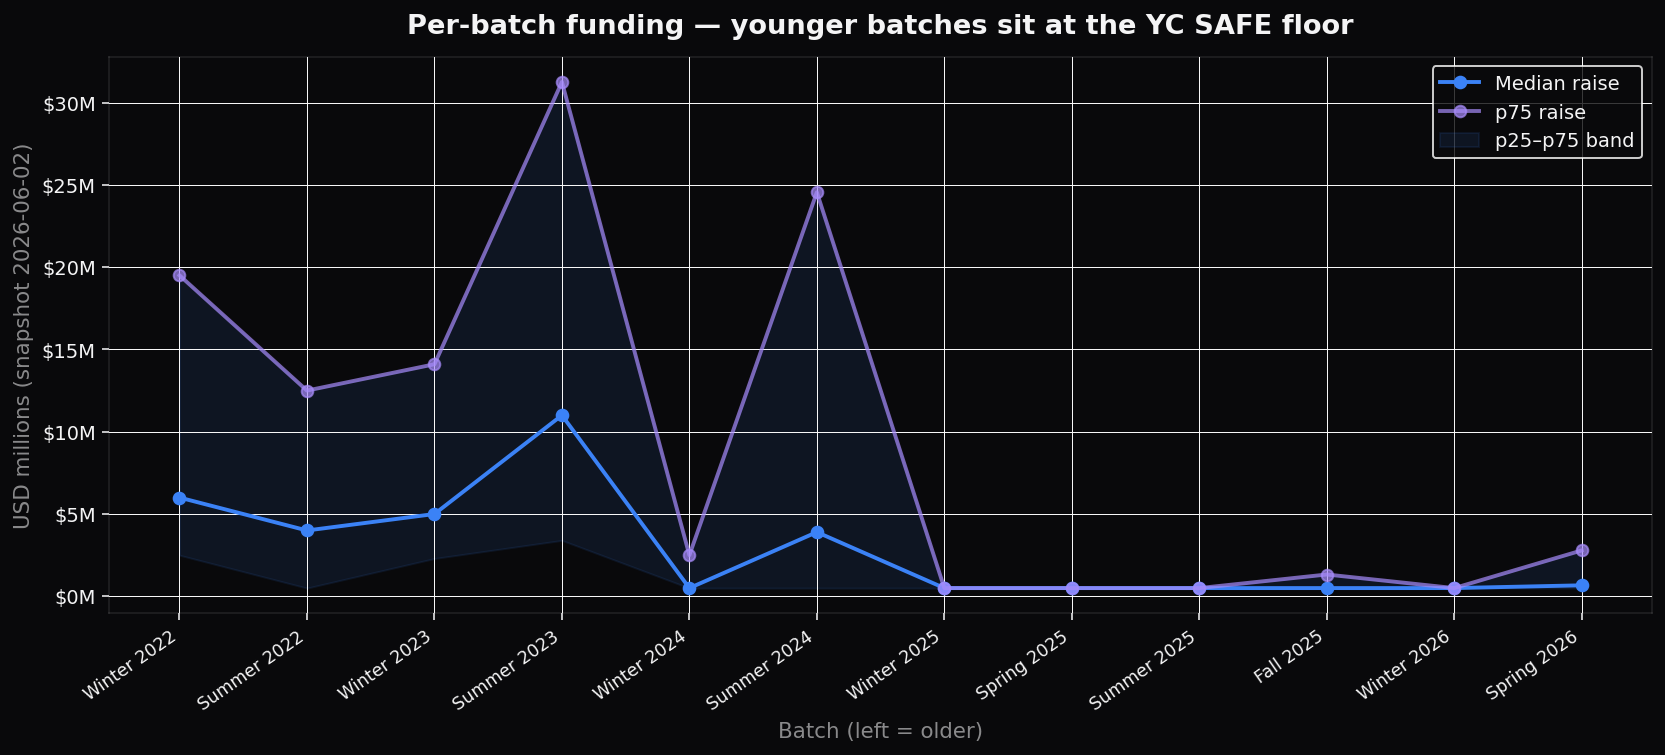
6. Per-batch curve — younger batches sit at the SAFE floor
Plotting median raise by batch reveals a clean staircase: older batches (W22-S23) have closed Series A/B and show medians in the $4-11M range. Anything from W24 onward is still in YC SAFE territory because there hasn't been enough time. The p25-p75 band collapses to a single line at $500K for recent batches.
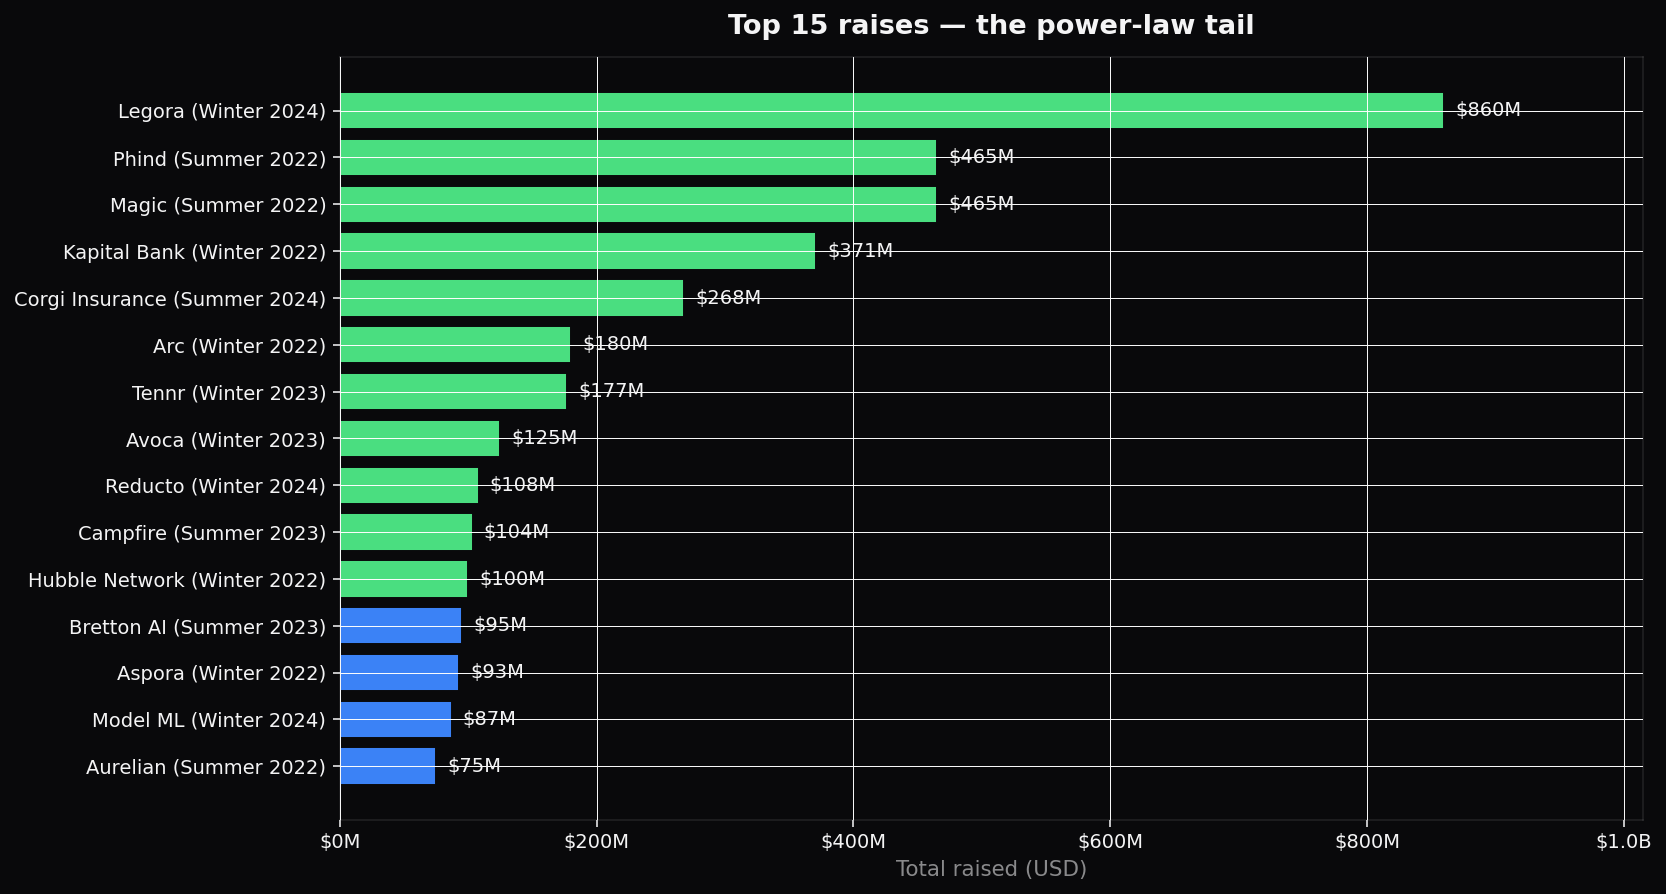
7. The top 15 — who actually made it
These are the 15 companies carrying the weight of the entire portfolio's sum-raised. Six unicorns, vertical AI plays in legal/fintech/insurance/healthcare/banking. Notice the batches — Legora is W24, Phind/Magic S22, Tennr W23. The biggest outliers are not from the youngest batches (no time) nor the oldest (those companies have either crossed into late-stage with bigger valuations or quietly died).